The client
A bank where a million decisions a day ran on rules
Financial fraud losses reached $41 billion globally in 2023, and the average cost of fraud for financial institutions rose 19.8%. Across the industry, traditional rule-based systems catch roughly 65% of fraudulent transactions.
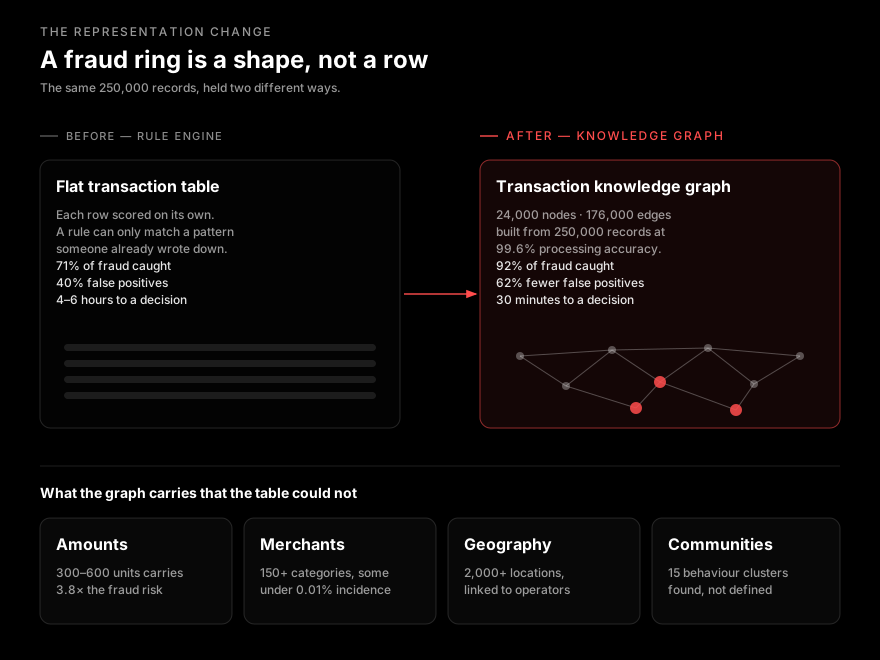
This client — a top-20 banking institution processing over a million transactions daily — sat just above that line at 71%.
Which is to say almost three in ten got through.
The challenge
Catching more fraud without drowning the analysts
Raising the detection rate is easy if you do not care about false positives. This bank cared. Its existing rules already produced 40% false positives, and every one of those was an analyst’s afternoon.
The incumbent
Five things had to move at once. Detection had to rise from 71% without inflating false positives. The 40% false-positive rate had to come down, not hold steady. Detection had to become proactive — identifying emerging patterns rather than matching known ones. Whatever the system flagged had to be interpretable, because the analytics team had to act on it. And the four-to-six hour response window had to shrink.
Constraints
What we had to design around
- VolumeOver 1M transactions a day, built against 250,000 historical records, with a production requirement of 2.5M transactions daily.
- LegibilityA score with no explanation is not actionable. The analytics team had to see why, and had to be able to turn what they saw into rules themselves.
- ComparisonThe system would be judged against an incumbent rule set everyone already trusted, so the gain had to be legible — not merely statistically significant.
- BreadthFraud signal lives across amounts, merchant categories, demographics, geography and internal operator behaviour. A flat table loses the connections between them, and the connections are the signal.
The last of those is the one that decided the architecture. Fraud is not a property of a transaction. It is a property of a pattern of transactions — and a pattern is a set of relationships that a row-shaped store has nowhere to put.
Our approach
Model the relationships, not the rows
A rule engine asks whether a transaction matches a known bad pattern. A graph asks who this transaction is connected to, and what those connections look like collectively. The first can only ever find what someone already wrote down.
What we built it from
Construction ran at 99.6% data processing accuracy, with only 0.4% requiring manual review. The graph incorporates transaction amounts, merchant categories across 150+ categories, user demographics, transaction locations mapped across 2,000+ points, and internal operator details — all of it in one structure rather than five joins.
The solution
Three analyses over one graph, two consumers
The graph is built once. What changes is who reads it and why.
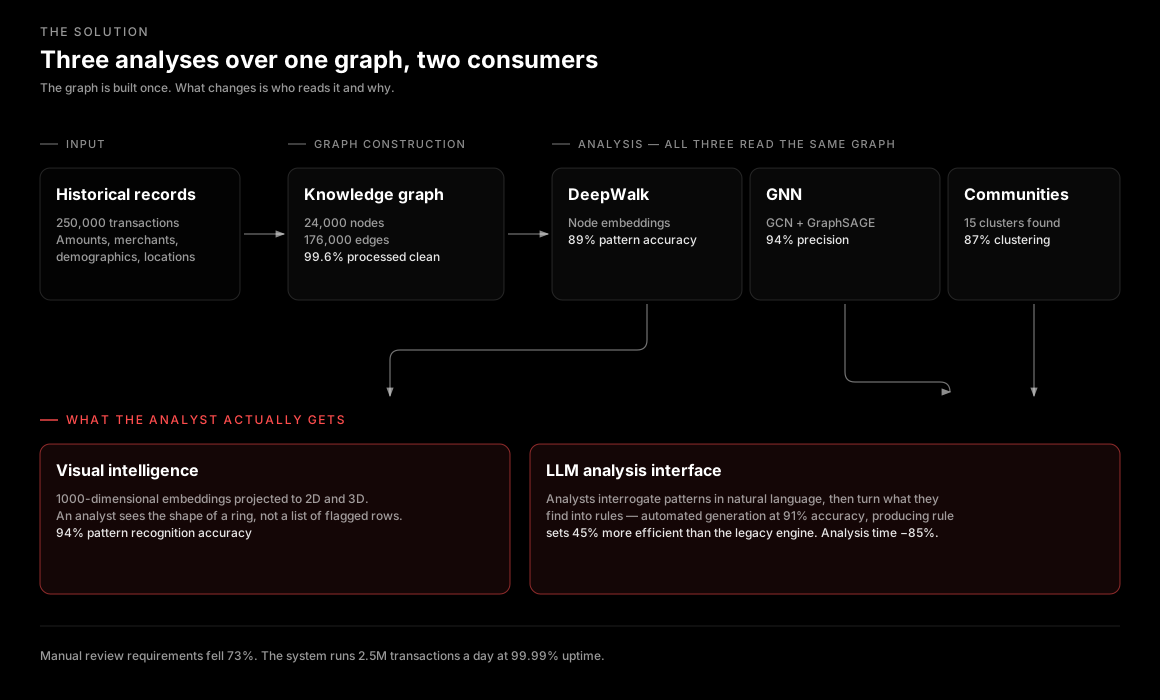
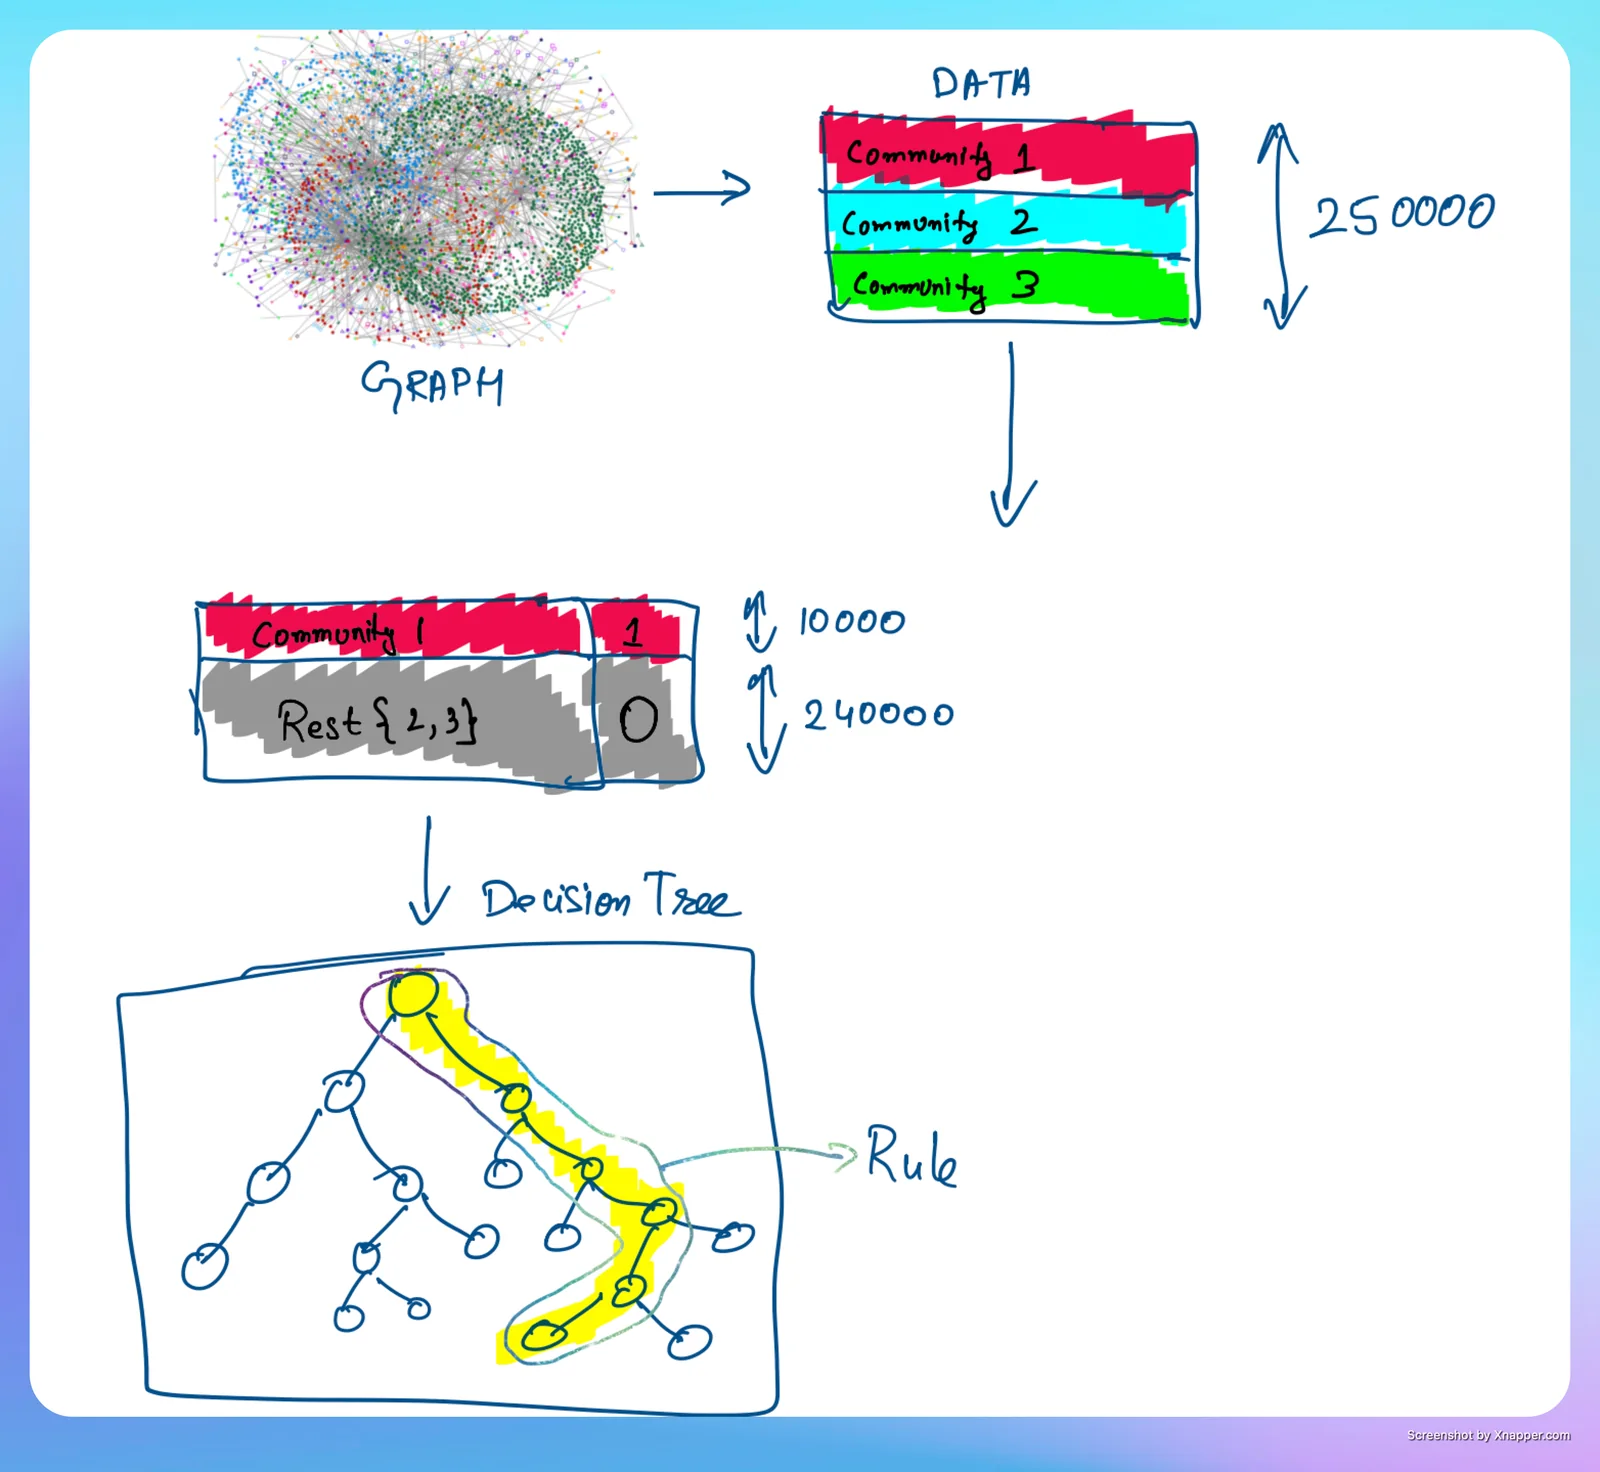
Representation learning. DeepWalk generates node embeddings at 89% accuracy in pattern recognition. Graph neural networks — GCN and GraphSAGE — run over the same structure at 94% precision. Community detection clusters behaviour at 87% clustering accuracy, resolving 250,000 transaction rows into 15 distinct clusters.
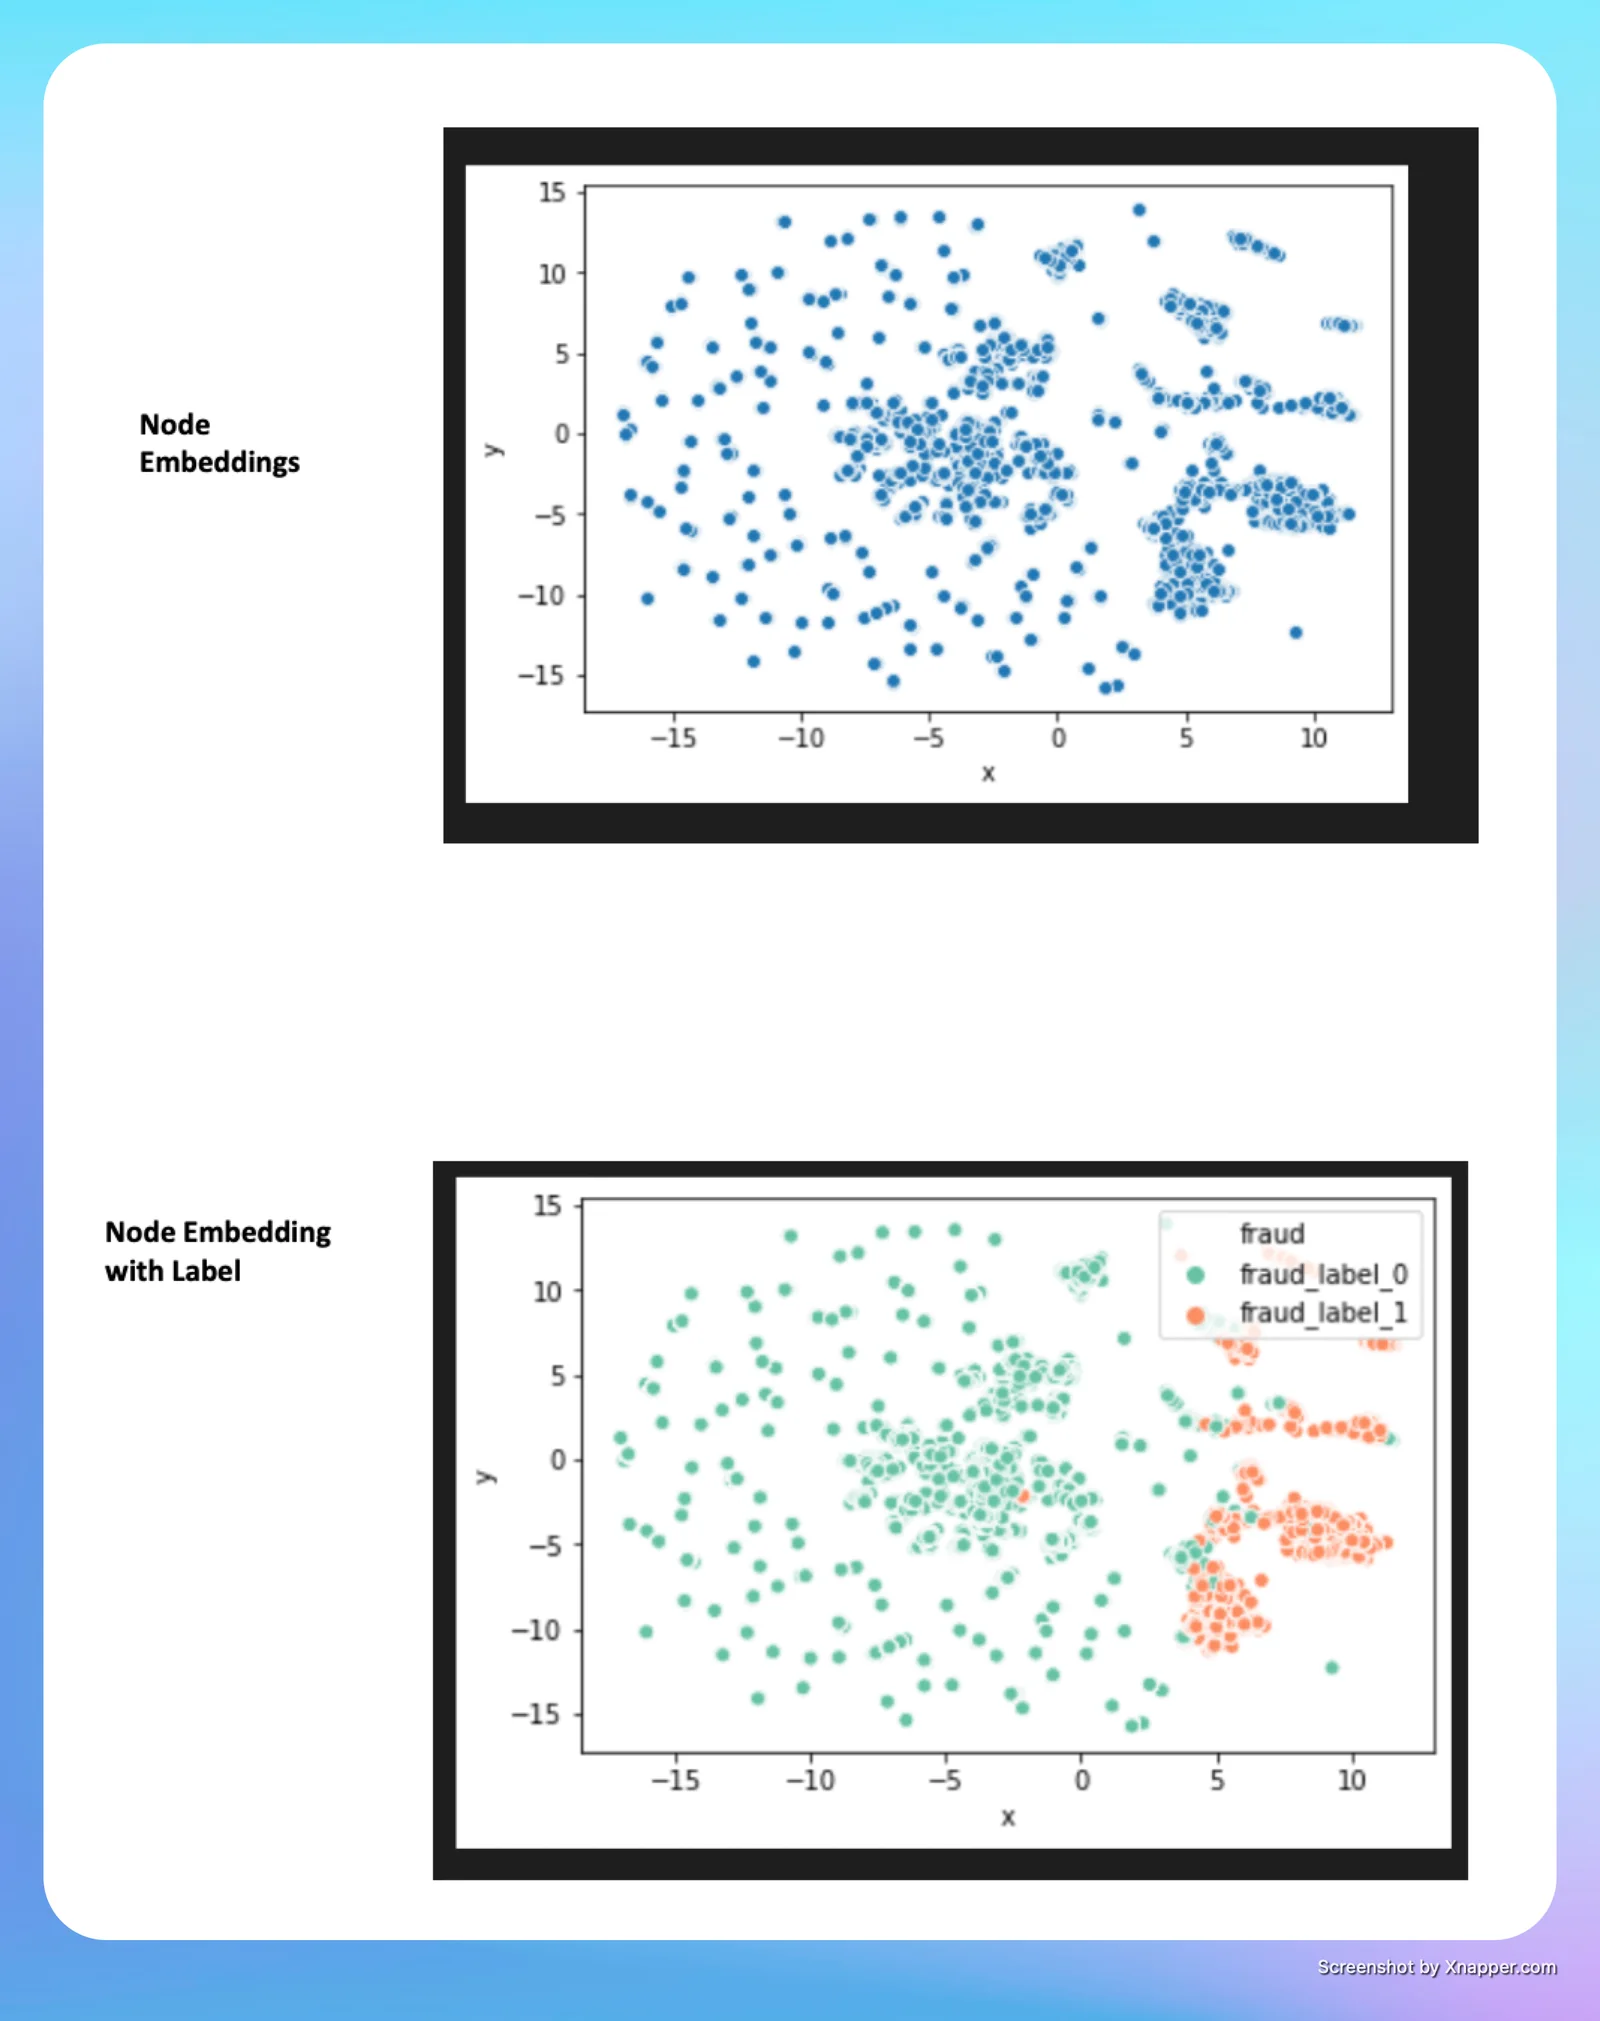
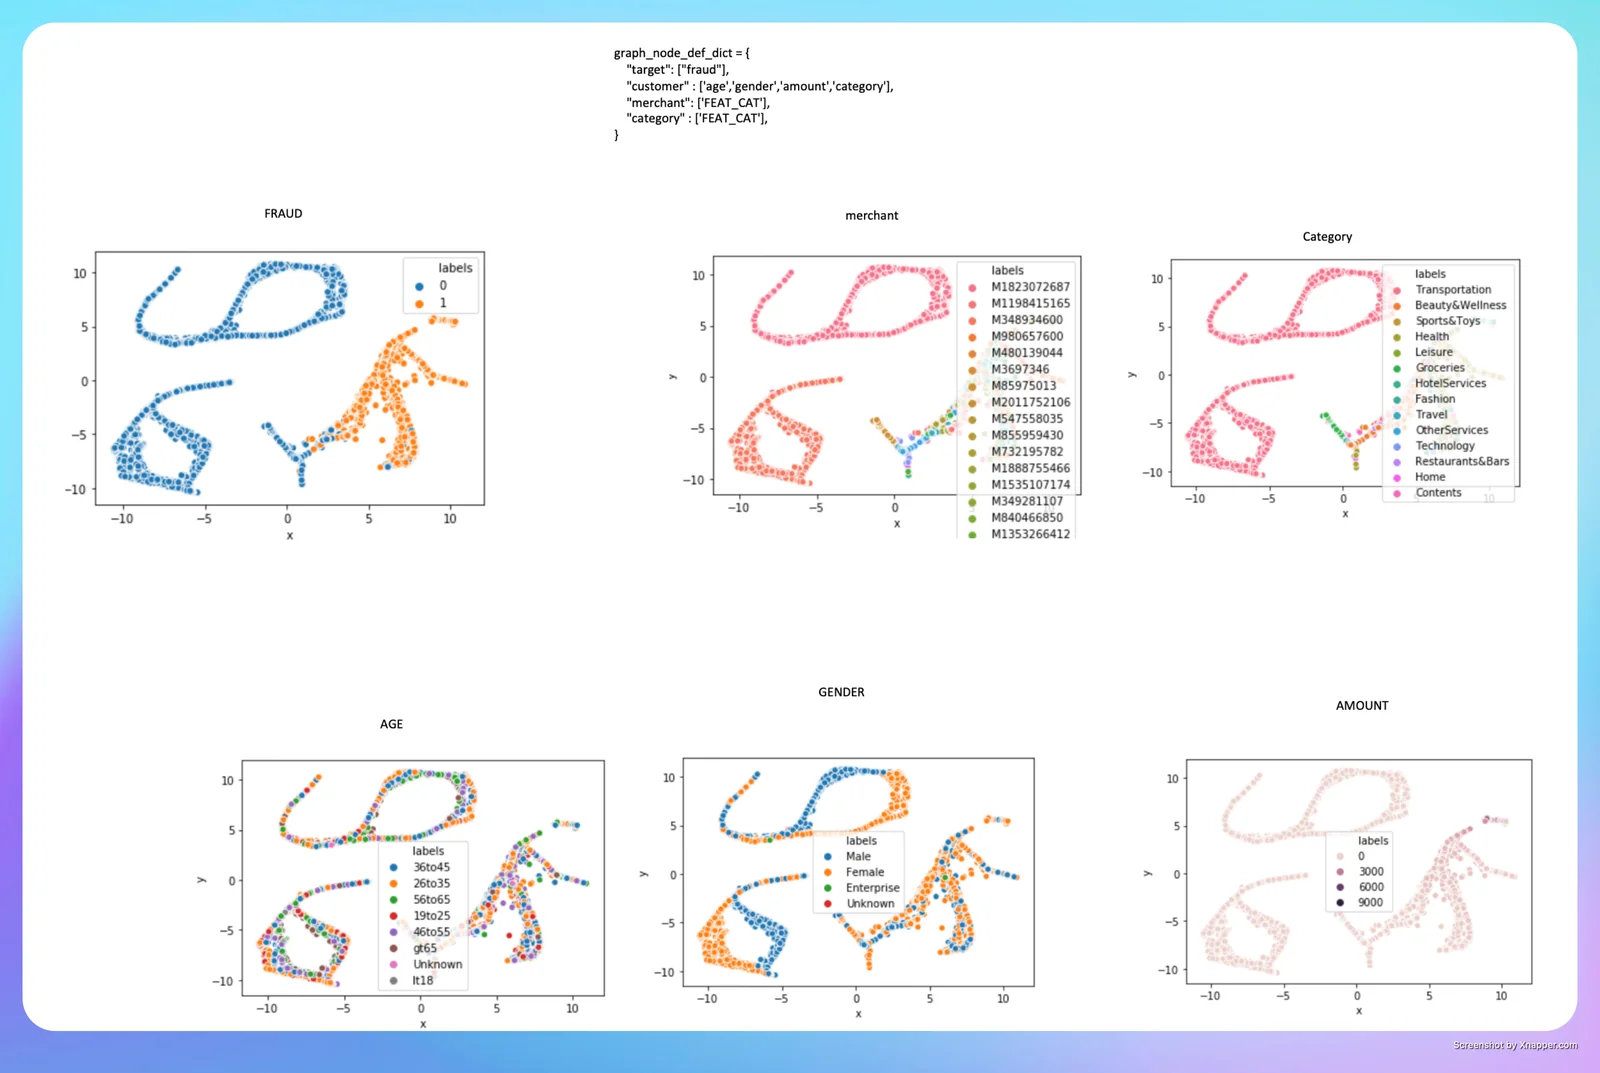
Visual intelligence. 1000-dimensional embeddings reduce to 2D and 3D projections at 94% pattern recognition accuracy. An analyst sees the shape of a fraud ring rather than reading a list of flagged rows.
Interactive analysis. An LLM layer lets analysts interrogate patterns in real time, cutting analysis time by 85%. Decision-tree models built from the graph reach 91% accuracy, and rule generation is automated at the same 91% — producing rule sets 45% more efficient than the legacy system.
Responsible by design
A flag an analyst can argue with
The interpretability requirement was not a nice-to-have; it decided the design. A model that raises a high-confidence flag nobody can explain creates two failures at once: the analyst cannot justify acting on it, and cannot justify ignoring it either.
So the output of every analysis path lands somewhere a person can interrogate it — the 2D and 3D projection for shape, the LLM layer for questions in plain language, and generated decision trees for the rule the pattern implies. The team stopped receiving scores and started receiving explanations they could turn into their own rules.
That is also why some of the findings are negative and were kept anyway: gender showed effectively no correlation with fraud patterns, under 0.1%. A model that cannot tell you what does not matter is not being read carefully enough.
Results
Measured against the incumbent rule engine
- Detection rose from 71% to 92% within the first three months, with high-risk transaction flagging at 95% accuracy.
- False positives fell 62%, against a legacy engine generating 40%. Manual review requirements dropped 73%.
- Detection time went from 4 hours to 30 minutes, against a prior process that ran four to six hours.
- $12M in fraud losses prevented in the first quarter, alongside a 312% first-year ROI, operational costs down 35%, and $800K a year no longer spent investigating false positives.
The graph also surfaced things the rules could not. A transaction amount range of 300–600 units carrying 3.8× higher fraud risk. Merchant categories with under 0.01% fraud incidence, safe to stop screening. Prediction of emerging fraud patterns at 88% accuracy.
Beyond the numbers
What else changed
Against industry benchmarks the system detects 47% better than average, holds a false-positive rate 52% lower than standard, processes 3.2× faster than traditional systems, and costs 45% less per fraudulent transaction detected.
Rule set updates got 75% faster and team efficiency improved 54% — both downstream of the same thing. When an analyst can see why a pattern is a pattern, writing the rule for it stops being guesswork.
One qualifier worth stating plainly: the results above reflect actual implementations across multiple financial institutions rather than a single engagement, and individual results vary with organisational context and implementation scope. The industry figures in the opening — $41bn in global losses, the 19.8% cost increase, the 65% typical catch rate — are published third-party research, not our measurements.
If your fraud rules are catching less than you would like
The first question is not which model. It is whether your data is shaped so the patterns can be seen at all — and that is answerable from your own historical transactions.