The client
Hundreds of farms, one spreadsheet at a time
A large-scale livestock producer operating across hundreds of farms.
The scale is exactly the problem. At that size the only tractable unit of decision-making becomes the barn — and the barn is the wrong unit.
The challenge
Feeding the average animal
Entire barns were fed based on what “most animals need” instead of what each individual animal actually requires.
Five problems compounding on each other: massive data fragmentation across hundreds of farms with no single view; one-size-fits-all feeding based on averages; systemic overordering with costly safety buffers, because uncertainty gets priced in as excess; manual spreadsheet decisions where real-time intelligence was needed; and inefficient logistics with poor routing and timing.
The cost of feeding an average
The size of that gap is well established in the animal science literature, which is worth stating because it is independent of us. Feeding pigs daily tailored diets instead of a group ration has been measured against conventional phase feeding, repeatedly:
Industry context — peer-reviewed research, not our measurements
Those figures come from published animal science, not from this deployment — see Precision pig feeding: a breakthrough toward sustainability and Precision livestock feeding: matching nutrient supply with nutrient requirements of individual animals. We include them because they establish that the prize is real before we claim any of it: the 20–30% feed waste reduction measured on this deployment sits inside that envelope rather than above it.
Constraints
What we had to design around
- GranularityThe unit of decision had to become the individual animal while the operation stayed at hundreds of farms — precision and scale pulling against each other.
- SourcesThe signal lives across sensor readings, genetic markers, health scores, maintenance PDFs, weather feeds and market data. Different formats, different cadences, no shared key.
- Field useThe people who act on this are in barns, not at desks. A dashboard that assumes a laptop is a dashboard nobody opens.
- CausalityA conventional database records that an animal gained weight. It cannot express why, which is the only actionable part.
Our approach
Model the relationships, because the relationships are the answer
The distinction the whole engagement rests on:
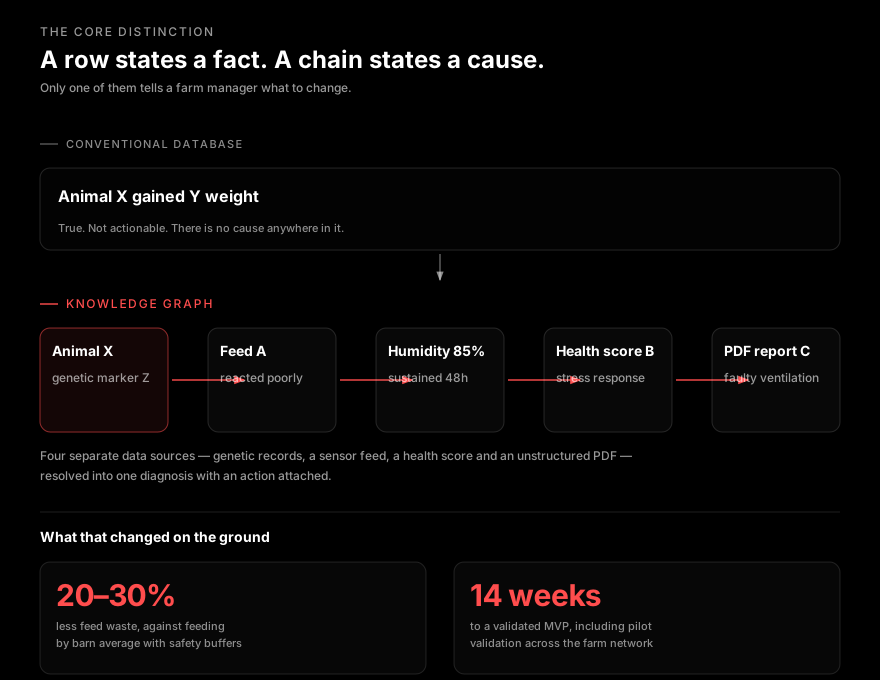
A traditional database says “Animal X gained Y weight.” That is true, and it is not actionable, because it contains no cause.
The knowledge graph says “Animal X with genetic marker Z reacted poorly to feed A when humidity hit 85%, due to health score B, noted in PDF report C.” That is a chain of connections across four data sources — and only the chain is actionable.
The solution
A graph over the whole operation
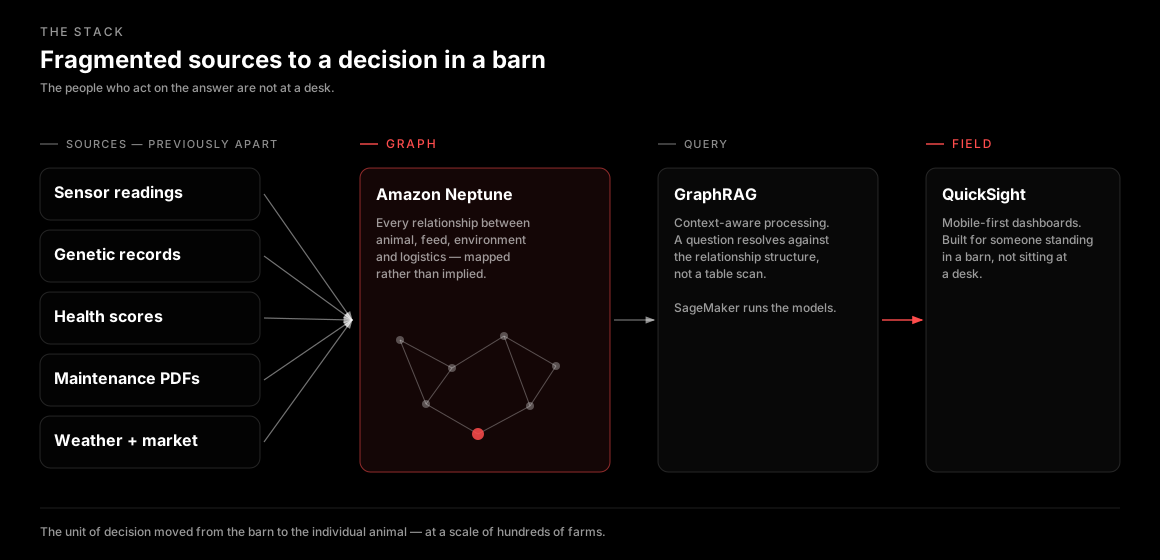
- Amazon Neptune — The knowledge graph itself — every relationship between animal, feed type, environmental condition and logistics factor, mapped rather than implied.
- GraphRAG — Context-aware processing over the graph, so a natural-language question resolves against the relationship structure rather than a table scan.
- AWS SageMaker — The machine learning platform running the predictive models.
- Amazon QuickSight — Mobile-responsive dashboards, built for someone standing in a barn rather than sitting at a desk.
- Multi-modal APIs — Weather, market and sensor data pulled into the same graph as the operational records.
Responsible by design
An answer that shows its working
A feed recommendation nobody can interrogate does not get followed. Farm managers have decades of judgment about their own animals, and a system that says “reduce feed in Barn 3” without saying why is a system that loses that argument every time.
Because the answer is a traversal rather than a score, it arrives with its chain attached — the marker, the sensor reading, the health score, the maintenance note. The manager can check each link against what they already know, which is how the recommendations earned their way into the daily routine.
It also means a wrong answer is diagnosable. If the ventilation PDF was stale, that is visible in the chain rather than buried inside a model.
Results
Diagnosis in one query
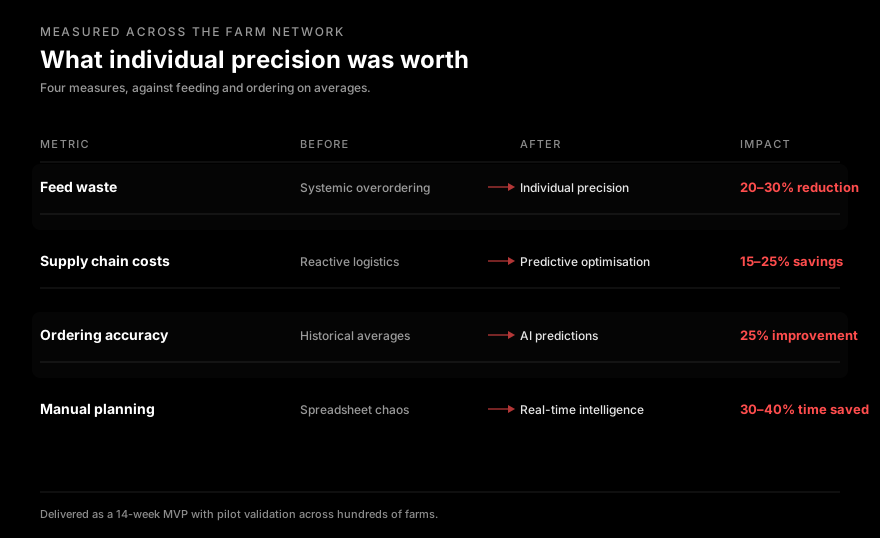
- Feed waste fell 20–30%, against feeding by barn average with systemic overordering and safety buffers priced in.
- Supply chain costs fell 15–25%, as predictive optimisation replaced reactive logistics — the routing and timing problem that sat underneath the feed problem.
- Ordering accuracy improved 25%, with AI predictions in place of historical averages. This is what removes the safety buffer rather than merely shrinking it.
- Manual planning time fell 30–40%, as real-time intelligence replaced spreadsheet planning across hundreds of farms.
- Individual-animal precision at scale, in a 14-week MVP— the decision unit moved from the barn to the animal without the operation shrinking to make that possible.
The illustrative case from the deployment: asked “Why is feed waste suddenly high in Barn 3?” the system answers that the 5,000 pigs with a particular genetic marker are stressed by faulty ventilation noted in a maintenance PDF, reducing intake, with the humidity sensor showing 85% for 48 hours — and recommends fixing the ventilation and adjusting the feed blend for stress response.
Beyond the numbers
What else changed
The knowledge graph approach built here now underpins work well outside agriculture — healthcare patient relationship mapping, manufacturing supply chain optimisation, enterprise operational intelligence and smart-city infrastructure.
Agriculture was where the pattern got proven, not where it stops. Complex multi-source operations turn out to be one problem wearing different clothes.
One note on the evidence: the Barn 3 exchange above is an illustrative example of the system’s reasoning rather than a logged incident. The four measures are as reported at the close of the engagement, and the independent animal science cited earlier brackets rather than contradicts them.
If your operation makes decisions on averages because the data is fragmented
The question is whether the relationships between your sources are recoverable. Usually they are — they are just not expressed anywhere yet.